
See Your Green Impact with our Community Compost Tracker
Want to go green for Earth Day (and beyond)? Participating in Hudson River Park’s Community Compost Program is one easy way to get started that benefits our Park’s thriving green space and our urban environment.
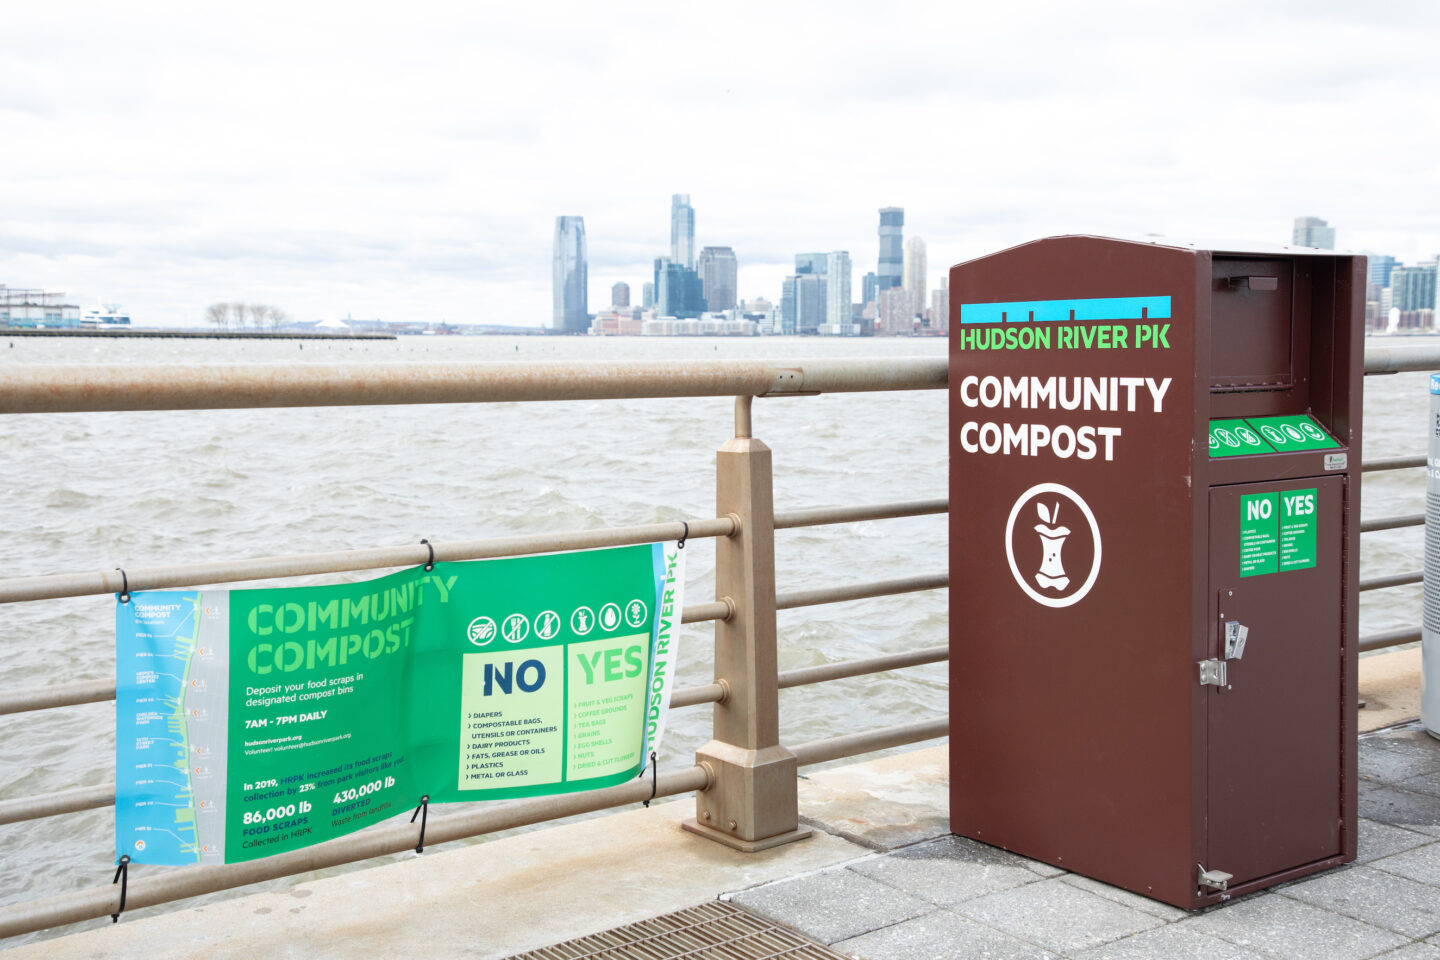
Our Community Compost Program provides 10 food scrap drop-off locations throughout the Park, open every day from 7:00 AM to 7:00 PM. At each drop-off location, we collect food scraps like coffee grounds, eggshells and other organic materials.
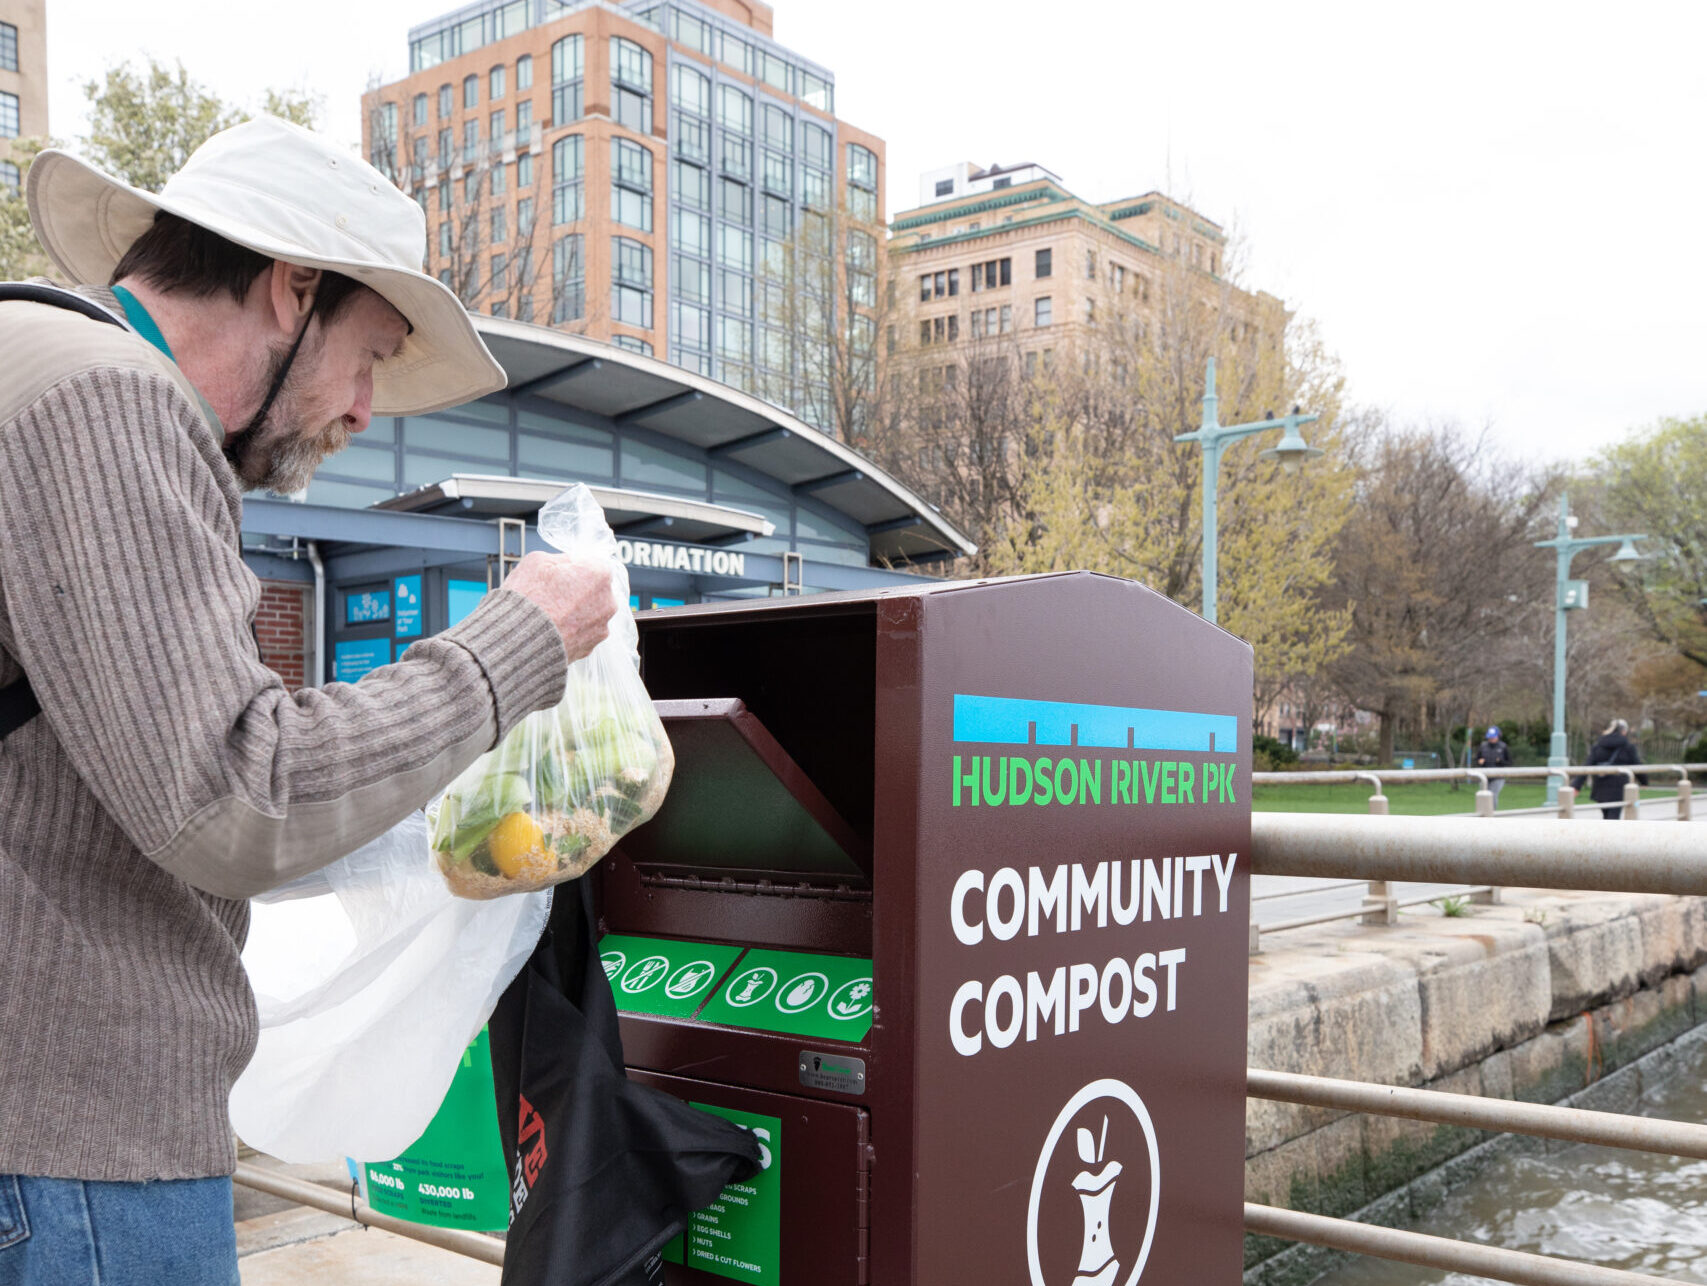
This compost is used throughout the Park, protecting plant beds from disease, pests and erosion. Diverting organic waste from landfills and recycling it into compost also reduces Hudson River Park’s carbon footprint and creates long lasting climate-smart benefits for our local community and planet alike.
You might be surprised to learn that NYC and its residents produce approximately 48 million pounds of waste every day. Much of this waste ends up in landfills beyond our city limits, sometimes as far away as South Carolina. The trucks and barges carrying all this waste utilize fossil fuels that harm our planet.
When we burn fossil fuels like coal, oil and natural gas to transport our garbage, we release carbon dioxide into the atmosphere. Our atmosphere is like a blanket that surrounds Earth, keeping some heat in and letting the rest out. As we burn excess fossil fuels, carbon dioxide is released into the atmosphere which thickens this blanket and traps more heat than it should. When this happens, our oceans absorb much of this excess heat, causing water to expand and ice sheets at the Earth’s poles to melt, increasing sea levels around the world.
Coastal communities like NYC are particularly vulnerable to climate change impacts such as flooding, storm surge and more frequent, intense storms. Composting our food scraps is one way that we can act together to reduce our reliance on fossil fuels and reduce the amount of carbon dioxide introduced into our atmosphere.
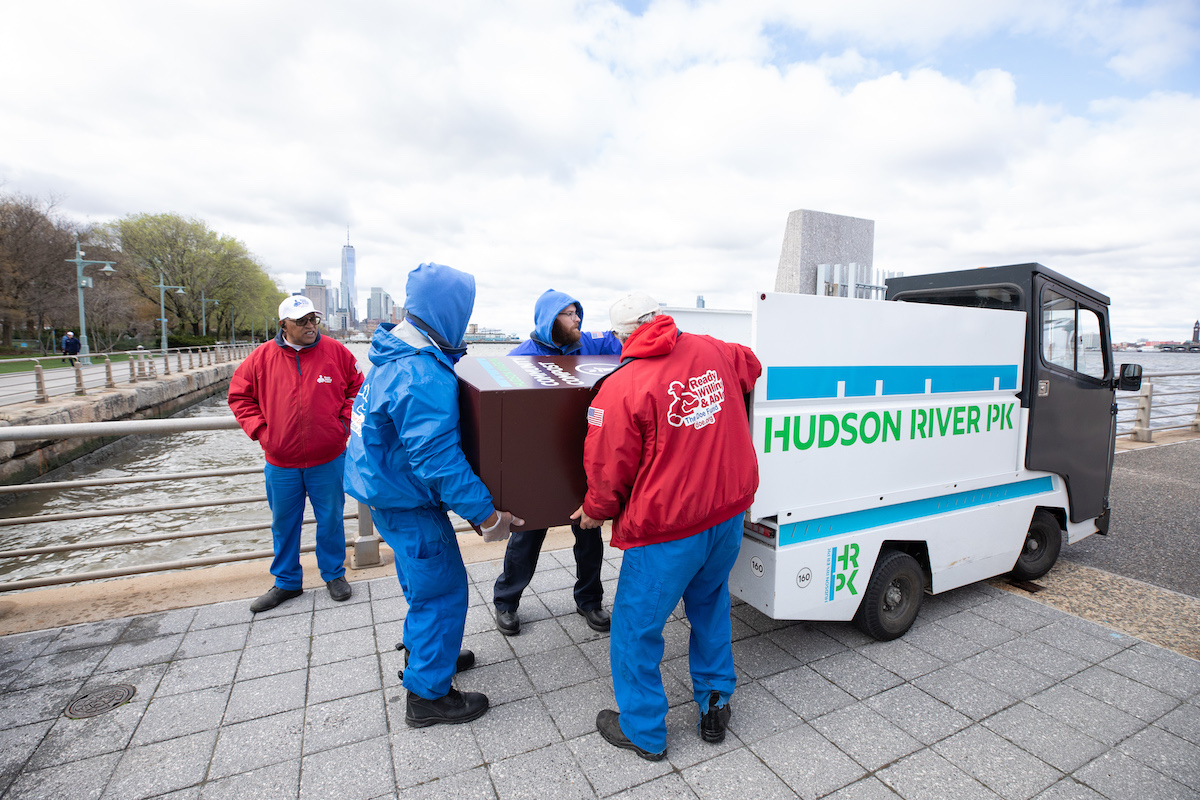
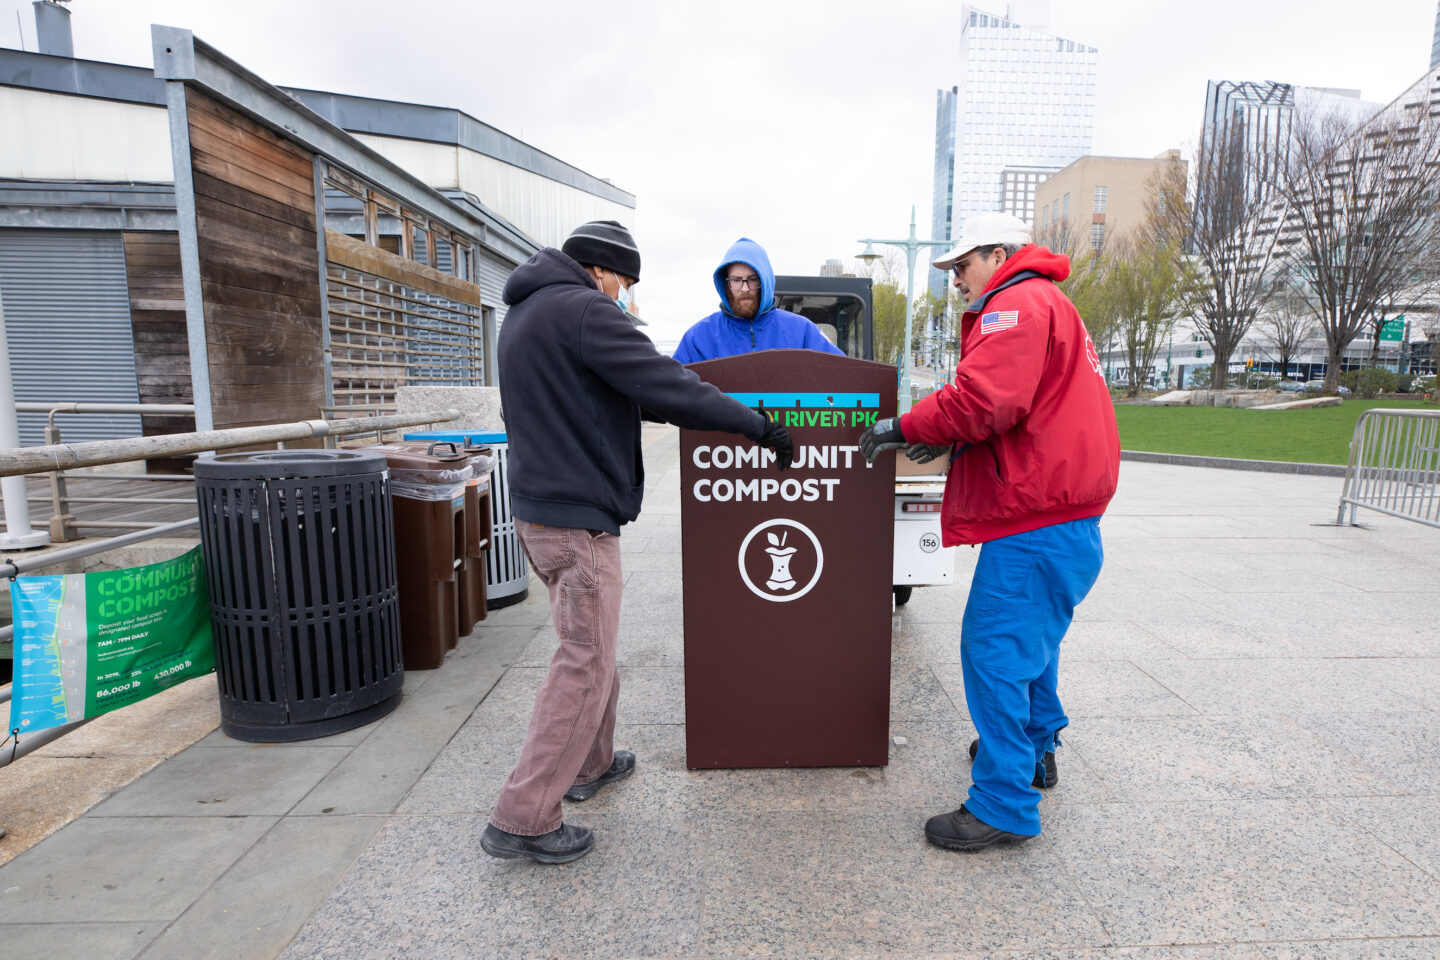
Recognizing the vulnerability of communities like ours to the impacts of climate change is one of the key reasons that Hudson River Park began our compost initiative in 2015. Our Community Compost Program has expanded substantially over the past seven years. Together with our community, HRPK diverted nearly 500,000 pounds of organic waste from landfills in 2021, and that number continues to grow! That’s why to celebrate Earth Month, we have launched Hudson River Park’s Community Compost Tracker Dashboard, introduced 10 updated drop-off bins across the Park and added a new compost machine. This will increase our food scrap capacity to further divert NYC waste from landfills.
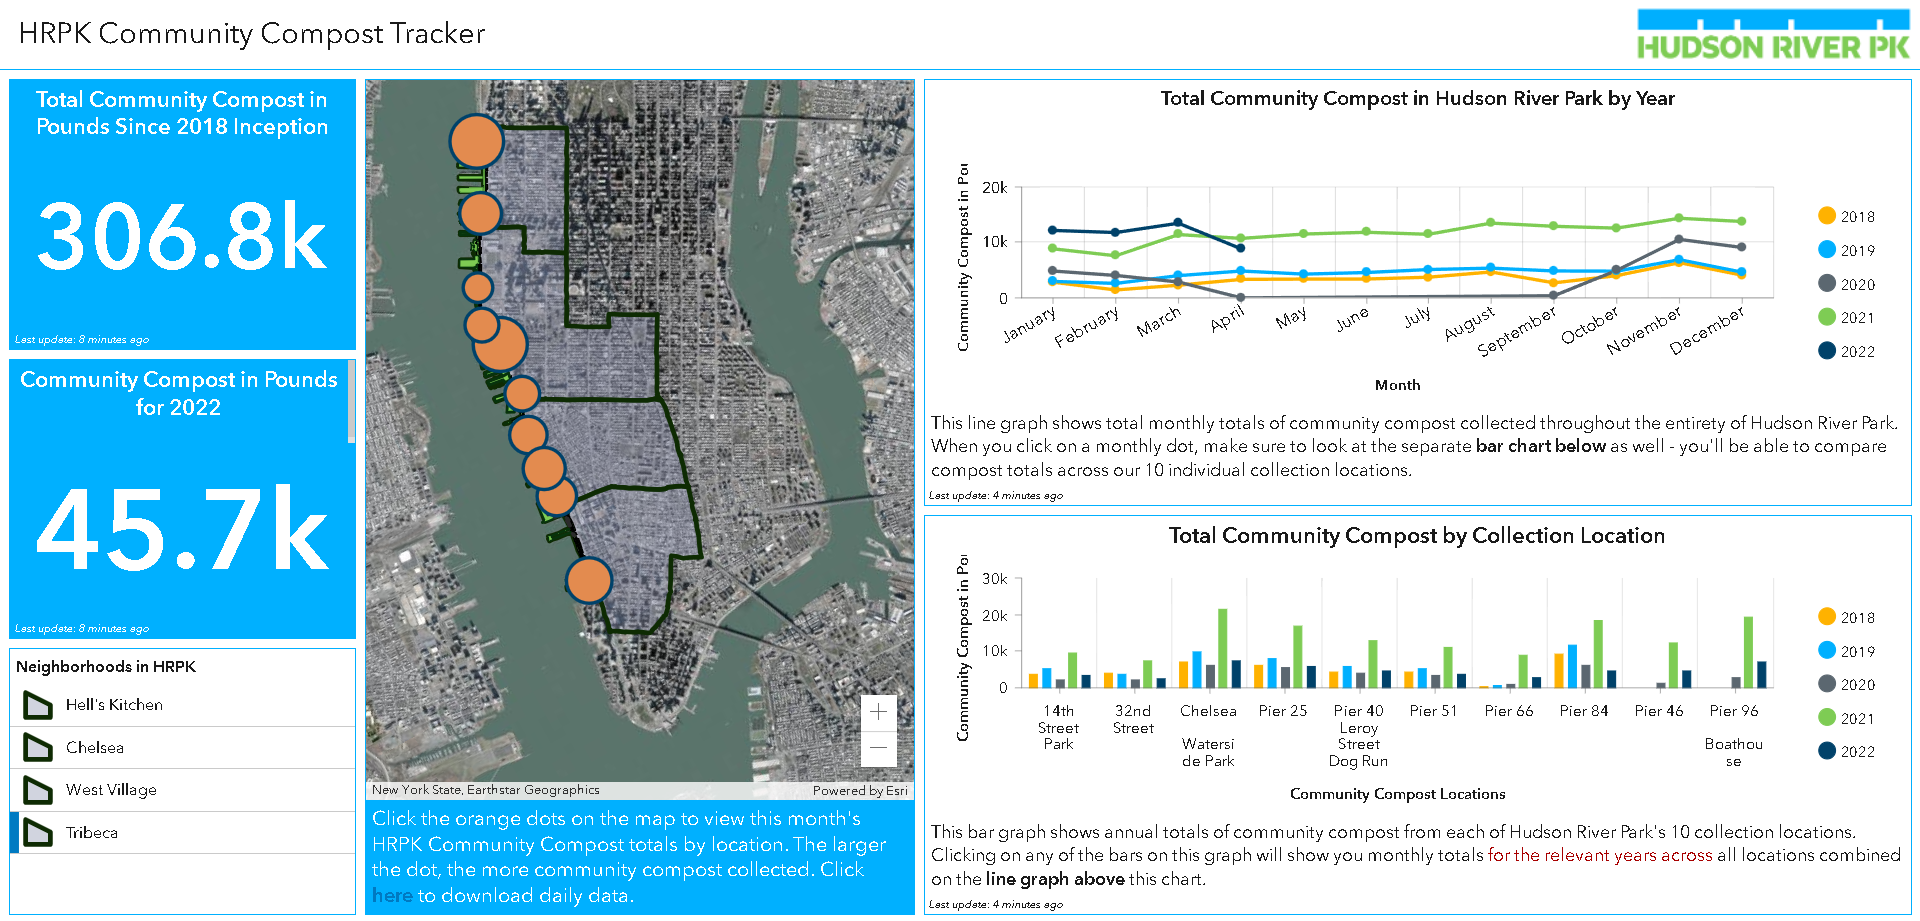
Our new Community Compost Tracker shares more information about the organic food waste that is collected at each of the Park’s 10 drop-off locations. This interactive dashboard is the perfect place to learn more about the collective impact of your food scraps on the Park.
Opening the tracker, you will see several sections displaying data that is updated regularly. On the left side of the page, you can see the total amount of compost that has been processed since the Community Compost Program’s inception in 2018. Immediately below that, you can see the total pounds of compost collected so far in the current year. In the last few years, HRPK has turned over several hundred thousand pounds of food scraps and yard waste into useful compost!
You might notice that these numbers are less than HRPK’s annual total waste diverted through the compost initiative. That is because this dashboard only accounts for community food scraps and it does not include Park horticulture waste, which is a significant part of our annual totals which you can read in our annual Waste Report.
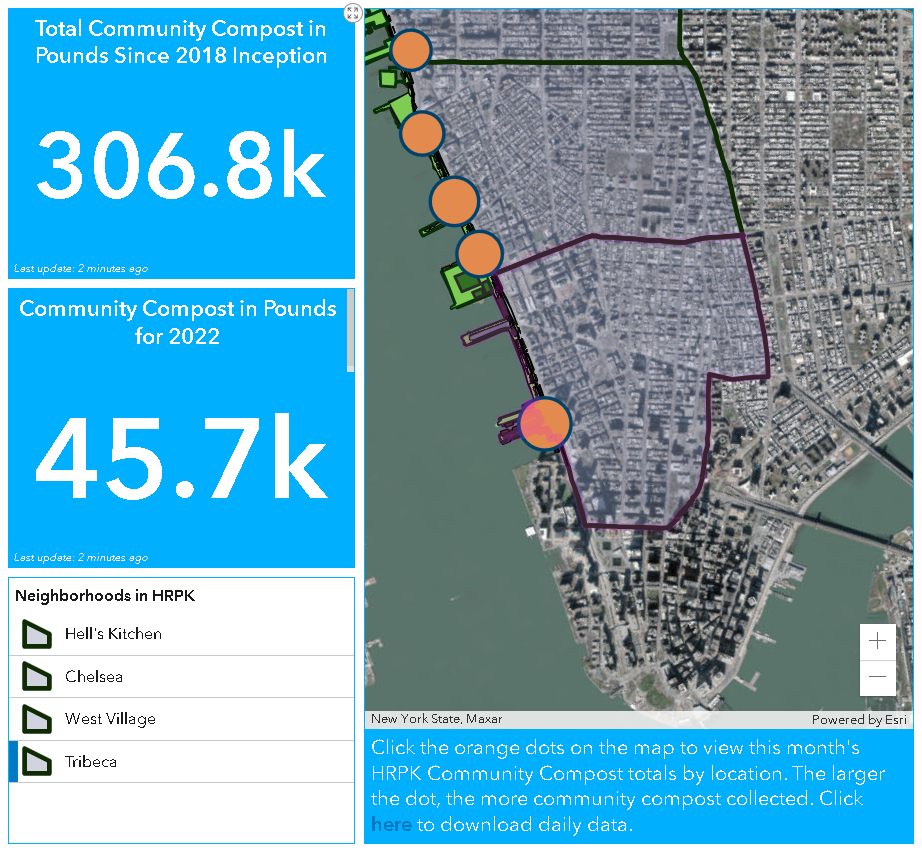
Next, take a look at the map in the center of the dashboard. The dark green lines indicate the four Manhattan neighborhoods included in the span of HRPK. Click on an orange dot to view monthly compost totals of a specific food scrap drop-off location. You can compare your preferred spot with the others in your neighborhood. In the blue box below the map, click the link to access and download daily data.
Moving to the right side of the screen, you’ll see two different visualizations of our compost data. These graphs interact with one another to display trends. Curious about the interconnectivity of this data? By clicking on points of interest, you can easily manipulate the dashboard to show certain relationships.
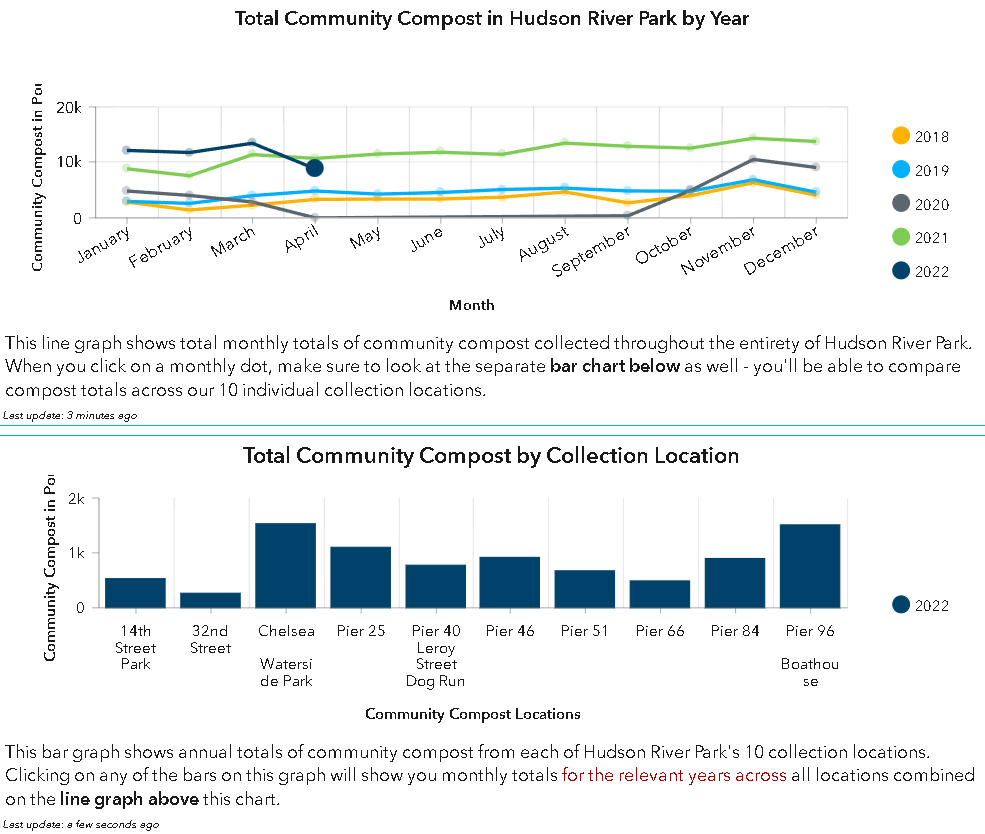
On top are line graphs displaying the monthly Park totals of compost since 2018. These values are important to our understanding of the trends in compost activity over time. Click on a month’s dot and see that the bar graph below now shows the totals for that month at each location. Explore to discover the most and least active food scrap drop-off sites during a specific time period.
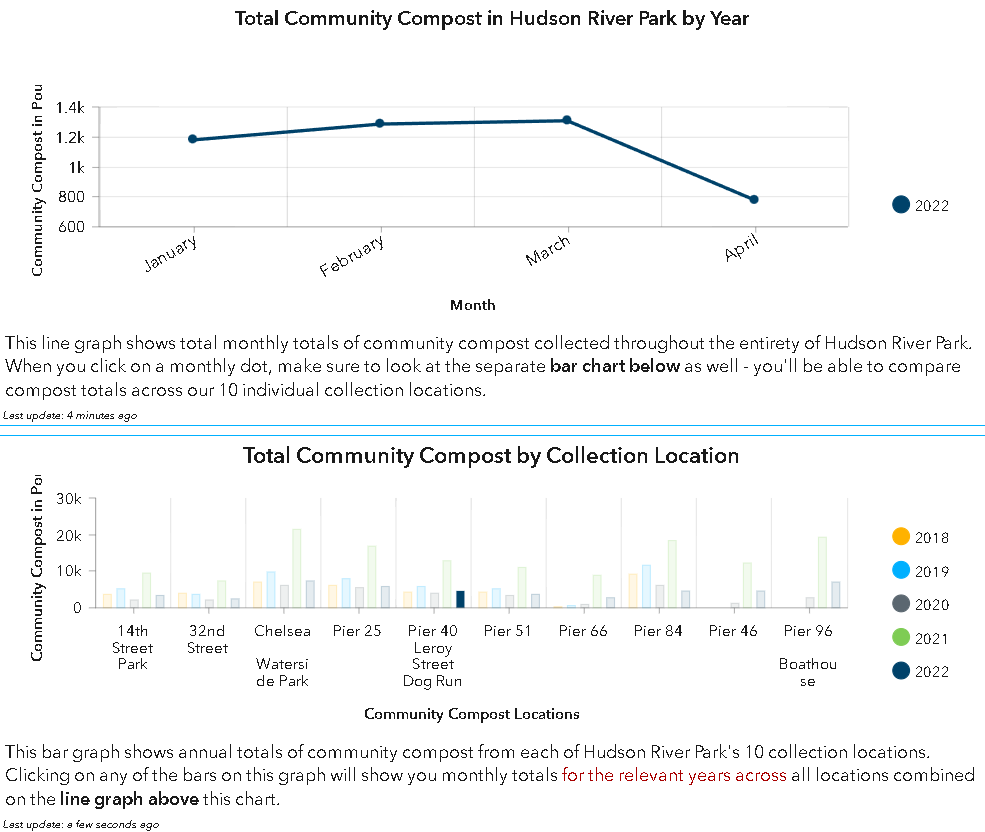
The bar graph below shows the annual totals of each drop-off location. Click on a bar to highlight a specified year’s total at one site. Notice the above line graph will now display that location’s trend of monthly compost contributions. Here you can investigate the changing habits of our community through different seasons at different sites.
HRPK’s Community Compost Dashboard is interactive and precise, giving you access to the most relevant information at any given time. We are proud to share this resource with our community and bring greater data accessibility to the public. We hope that you will find the information as interesting as we do!
To learn more about our Community Compost Program and how you can get involved, please visit here.