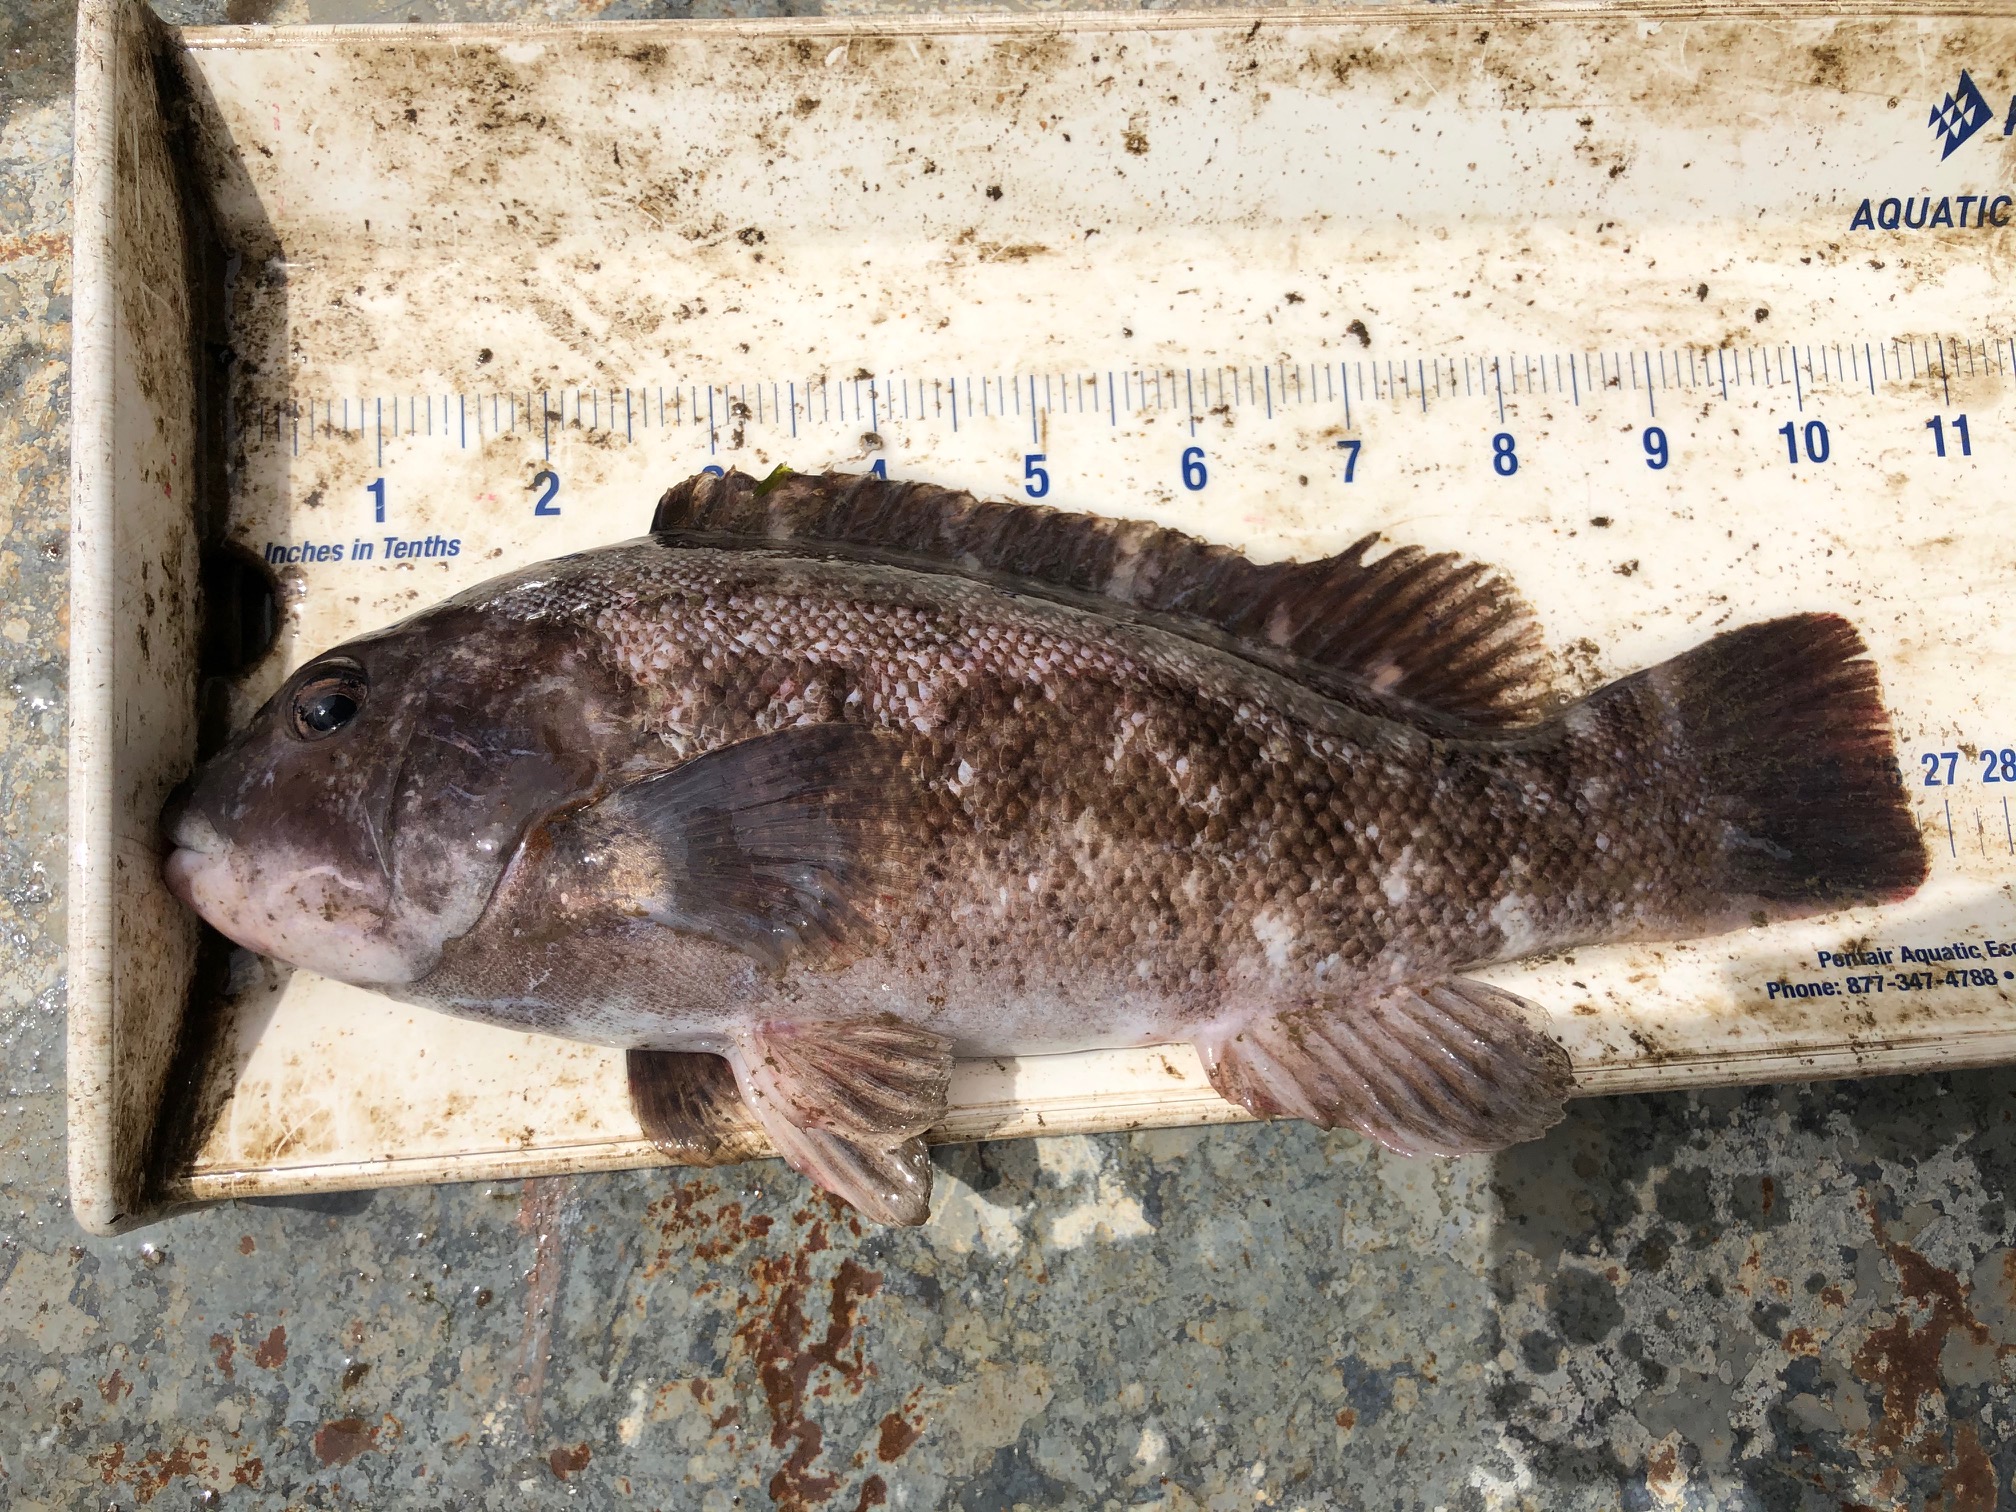
Have you ever wondered what it would be like to be a marine scientist? What kind of research do marine scientists do and why is it important? In this lesson, students will be introduced to the Fish Survey, a 30-year research project that monitors the presence of different fish species in the lower Hudson River Estuary. 
Students will learn about four common Hudson River fish, then step into the role of a Hudson River Park marine scientist to look inside ‘fish traps’ to examine the catch of the day and create simple bar graphs that illustrate data from their survey.
Themes: Hudson River Ecology, Native Species, Field Science, Species Samples
Ages: 7-10
Prep Time: 5 min
Activity Time: 20-30 min
Resources:
Hudson River Fish Wish Cards
Fish Trap Graphing Worksheet
Fish in Hudson River Park Poster